The Rongowai mission makes innovative use of GNSS signals to form a radar.
What is GNSS-R (Global Navigation Satellite System Reflectometry)?
Global Navigation Satellite System (GNSS) is the general name given to navigation systems that make use of satellites for providing the positioning, navigating and time-keeping services that we use every day. GNSS signals are truly global — they can be picked up anywhere on the surface of the planet as well as in the air and even in the highest layers of the atmosphere. The US-developed GPS system is the world’s most utilized GNSS system, but others include EU’s Galileo, and GLONASS (GLObal NAvigation Satellite System).
GNSS-R uses the GNSS signals reflected off the Earth for remote sensing. The properties of the reflected signal contain information about the surface
What is CyGNSS and how does it work?
Rongowai forms part of NASA’s Cyclone Global Navigation Satellite System (CYGNSS) mission, a constellation of eight small satellites, launched in 2016, that use signals from Global Positioning System (GPS) satellites that reflect off Earth’s surface to collect science data.
The CYGNSS satellites orbit above the tropics and their primary mission is to use GPS signals to measure wind speed over the ocean by examining GPS signal reflections off choppy versus calm water. This allows researchers to gain new insight into wind speed over the ocean, enabling a better understanding of hurricanes and tropical cyclones.

How does Rongowai fit in?
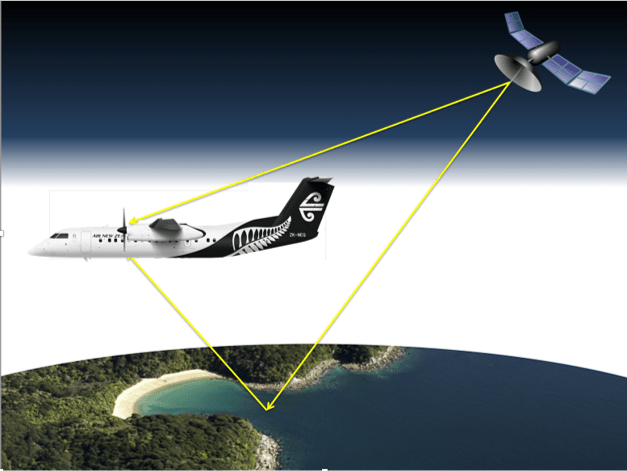 During each flight, the sensors on-board the Air New Zealand Q300 aircraft will record direct and reflected signals from up to 20 GNSS satellites simultaneously. The signals will form several transects from which soil moisture and surface water extent will be estimated.
Rongowai will test a new version of the sensors used on the CyGNSS satellites, which include additional signal frequencies and will incorporate Galileo (E.U.) GNSS satellites in addition to GPS. By taking the novel approach of mounting this next-generation GNSS-R receiver on a commercial Air New Zealand aircraft, Rongowai allows for an unprecedented collection of climate data over and around the islands of New Zealand. This data will include inundation and coastal dynamics, and soil moisture content and variability.
As the aircraft traverses New Zealand, it will collect data from the land below, some of which will overlap with the flight paths of the CYGNSS satellites. This overlap, which will have frequent data observations from regular commercial flights, will also provide the CYGNSS team a wealth of data to use to validate and improve the CYGNSS satellite observations. In addition, the varied New Zealand terrain will provide comparison points with data collected in similar terrains in other parts of the world.
The Rongowai payload is designed to operate for years on end without any physical intervention — it will only be physically accessible when the commercial aircraft undergoes a fully stripped-back maintenance session. Communication with the installed payload is driven solely by the payload itself, while the flight is on the ground, in a scenario where the payload “dials home” to the Science Payload Operations Centre (SPOC) using it’s cellular modem internet connection. During this “dial home” session science and engineering data can be transferred off the payload, in addition to uploading new data collection plans and software updates. Apart from these “dial home” sessions while a flight is turning around we will not be able to communicate with Rongowai.
Right: The Rongowai payload box which will be installed on Air New Zealand Q300 aircraft, undergoing lab-bench testing at the University of Michigan (Credit: University of Michigan)

Learn more about how Rongowai’s GNSS-R receiver works and how the Science Payload Operations Centre (SPOC) will use live-flight tracking to track data coverage in the presentation (Centre for eResearch, Dr. Mike Laverick)
To monitor where Rongowai may currently be flying we have developed a live-flight tracking tool that can follow the movements of a specific aircraft across New Zealand. The tool is built in Python and makes use of the Opensky Network which is a flight-tracking and historical flight database aimed primarily at providing flight data for researchers. Our live-flight tracker pulls data from the Opensky Network Live API to provide aircraft information every 10s. We have also installed four additional ADS-B receivers around New Zealand’s North Island to help expand the Opensky Network coverage. The live-flight tracker has been integrated with GNSS-R specular point simulation code to perform on-the-fly simulations and visualise the GNSS-R specular point data we expect to be collected by the flight in progress.
An example video of the live flight tracking tool: The multi-coloured line denotes the flight path. The pink tracks represent specular point reflection tracks that have been simulated on-the-fly using the live flight data. Blue diamonds denote major airports in New Zealand. Yellow diamonds denote the additional Opensky Network receivers that have been deployed as part of the Rongowai payload support.
This map (right) shows expected annual coverage, based on simulated data using observed operations of one Q300 aircraft. Over the course of one year, observations will cover a large proportion of New Zealand, with exact timings dependent on Air New Zealand scheduling and operations. A high density of observations (over 500 per year) occur close to regular flight routes, particularly close to airports. Areas without coverage are away from areas of aircraft operations, or as a result of signals being blocked by topography, such as along the west coast of the South Island.
(Image Credit: Ryan Linnabary, Matt Wilson)

Payload Operations
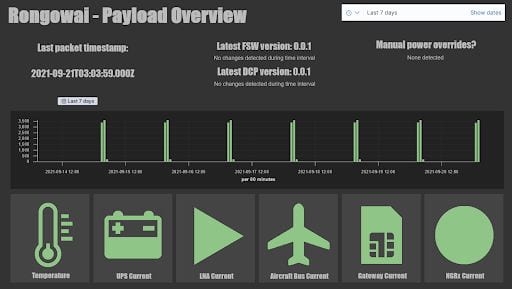
Rongowai will have little to no physical access during its operational lifetime, so it is important that payload health can be monitored remotely and frequently. The receiver produces engineering data on all key aspects of its hardware and software so that potential issues can be monitored and reported back when the payload communicates with the SPOC. These data report on a range of parameters including: voltages and currents of key components and whether thresholds have been exceeded for any temperature, voltage, or current sensors.
Left: The Rongowai engineering dashboard showing test-case engineering data for the payload.
When Rongowai connects to our data centre, binary-format engineering data is transferred and unpacked into a more usable file format and ingested into a dedicated Elasticsearch database for storage. An interactive Kibana dashboard has been developed to visualize this engineering data and monitor the health of the payload over a given period — typically the past week of data. Further dashboard pages offer more detailed plots of various parameters to help with an initial diagnosis of issues. The dashboard updates in real-time as data is ingested into Elasticsearch, and automated email/SMS warnings will alert to any critical issues.